


Poverty dynamics among young adult men in Scotland
A PDF of this report can be read here.
Summary
Poverty is a key driver of health inequalities. However, headline statistics can conceal important differences in how poverty affects people over time. These dynamics matter for health, because the effects of poverty are magnified when it is experienced persistently or repeatedly.
Previous research by SHERU found an alarming increase in poverty among young adult men in Scotland, who are at inordinately high risk of dying from drugs, alcohol, and suicide. Using data from the Understanding Society survey, this report digs deeper into the dynamics of poverty that these men experience.
The report is structured around three sets of questions, which are intended to provide a rounded view of poverty trajectories and thus to inform the design of effective, preventative policies.
How persistent is poverty among young men in Scotland – and how does this compare to the rest of the UK (rUK)?
- Men aged 18-44 have been more likely to be living in persistent poverty in Scotland than in rUK in most years since 2016-2017. Since that time, persistent poverty has also made up a higher share of poverty overall among young adult men in Scotland than it has in rUK – that is, when poverty among young adult men has occurred, it has tended to be more persistent in Scotland than in rUK.
Which young adult men are at greatest risk of falling into poverty – and which are most likely to move out?
- Men towards the younger end of the age range are most likely to enter poverty, but this risk by no means disappears for older age groups. Furthermore, those aged 35-44 demonstrate the lowest exit rate, implying that poverty is more persistent for these individuals when it does occur.
- Young adult men who are single but living with other adults, such as parents or housemates, enter poverty at a higher rate than those in most other living situations without enjoying higher exit rates. The exception is lone mothers, who face a similar entry rate and a lower exit rate. These young men are also more likely to move into poverty, and less likely to move out of poverty, than both young women in Scotland and young men in the rest of the UK who are in equivalent living situations. Further research is needed to understand the circumstances surrounding non-standard housing arrangements among young men in Scotland and their relationships to health inequalities.
- Young adult men working part-time experience higher entry rates and lower exit rates than those working full-time and those who are out of work. These men likewise have higher entry rates and lower exit rates than young women in Scotland and young men in rUK who are working part-time, although part-time work is less common among young men than it is among young women. More generally, young men in Scotland have lower exit rates than these comparator groups when they are working either full-time or part-time, pointing to issues of job quality that particularly affect young men in Scotland.
What events push young men into poverty – and what events pull them out?
- The two events that are most commonly associated with young men entering poverty are the individual moving out of work and the household experiencing a real-terms reduction in benefit income. Conversely, the individual moving into work and the household experience an increase in benefit are two the most common trigger events for poverty exits. Movements in and out of work occur relatively infrequently, but tend to be particularly consequential for poverty, whereas the opposite is the case for changes in benefit income as well as earnings. Cumulatively, labour-market events dominate the picture for both poverty entries and poverty exits.
The report concludes that preventative policy should focus on those who experience poverty persistently, while being sensitive to other factors such as depth of poverty, stability of income, and non-monetary dimensions.
Introduction
Recent research by SHERU found an alarming increase in poverty among young adult men in Scotland since the Covid-19 pandemic that was not observed in other regions of the UK or in other demographic groups.(1) These findings provided an early warning sign of a further deterioration in health outcomes among young men, who are already at inordinately high risk of dying from drugs, alcohol, and suicide.
This report digs deeper into the trajectories of poverty that young men experience. We know that such trajectories can vary significantly, beyond what is evident in headline statistics. Some households find themselves trapped in poverty for years, decades, or even lifetimes; others may only be in poverty for a short spell while they adapt to an unexpected change or undergo a specific life event; and still others cycle in and out poverty as their circumstances fluctuate.(2) We also know that these dynamics matter for health inequalities, and therefore for designing effective, preventative policies.(3)
Data from the UK Household Longitudinal Study, better known as Understanding Society, allows us to take this dynamic view by tracking individuals over time. The data are not perfect; for example, the timeline of the survey is not long enough for us to investigate poverty over the full life course, participants are only interviewed once per year, and we lack information about how income and expenditure are shared within households. The size of the survey sample is also a limitation for some analysis, and some key populations such as people who are homeless or in custody are excluded. Nevertheless, the data provide valuable insights into what pushes people into poverty and what pulls them out – and how these forces interact to determine whether their experience of poverty is short-lived or persistent.
This report is structured around three sets of questions. First, how persistent is poverty among young men in Scotland – and how does this compare to the rest of the UK (rUK)? Second, which young adult men are at greatest risk of falling into poverty – and which are most likely to move out? Finally, what events push young men into poverty – and what events pull them out? After answering these questions, we conclude by considering the implications for health inequalities and preventative policy.
Throughout the report, we define poverty in relative terms, as having household of income below 60% of the UK median, with income measured after subtracting housing costs and adjusting for household composition. The methodology draws on the Income Dynamics statistics published by the Department for Work and Pensions (see Annex).(4)
Findings
How persistent is poverty among young men in Scotland – and how does this compare with the rest of the UK?
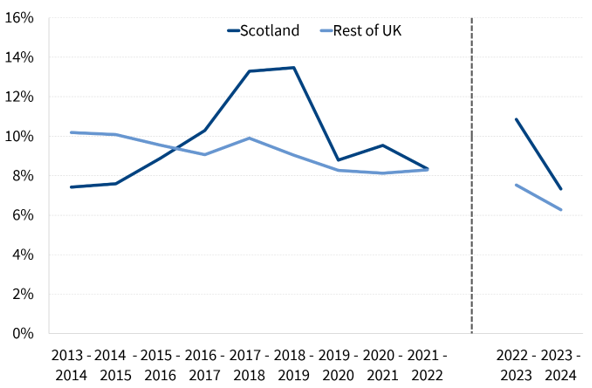
Figure 1 shows the persistent poverty rate among young adult men in Scotland as compared to rUK from 2013-2014 to 2023-2024. This represents the proportion of young adult men who have lived in relative poverty in at least three out of the last four years. The figure shows that young men have been consistently more likely to be living in persistent poverty in Scotland than in rUK since 2016-2017, with a persistent poverty rate of between 7% and 14%.
Note that data from 2022-2023 onwards is not comparable to data from previous years due to a boost in the survey sample, and is also expected to be revised (although new panel members have been added to the cross-sectional sample that is used to calculate median incomes – and therefore poverty lines – they have not yet been added to the longitudinal sample that is used to calculate persistent poverty rates.). (5) This makes it difficult to draw conclusions around how persistent poverty has changed since the Covid-19 pandemic. However, comparisons between different groups – such as young adult men in Scotland and rUK – should be more reliable than the absolute levels.
Figure 1: Persistent poverty rate among men aged 18-44
Source: SHERU analysis of Understanding Society.
In addition to examining the persistent poverty rate, we can consider the proportion of people living in relative poverty who are living in persistent poverty in each time period. This comparison is partly confounded by the fact that a household can be classified as living in persistent poverty in a given period even if they are not living in relative poverty in that period, provided they were living in relative poverty in the previous three periods. In addition, the persistent poverty rate must be measured longitudinally since it combines information from multiple survey waves, whereas relative poverty is a cross-sectional concept. To ensure consistency, we measure both relative and persistent poverty using the same sets of longitudinal weights, with the average relative rate over the past four years computed at an individual level. Note that the poverty line is set on a cross-sectional basis at the UK level in each wave.
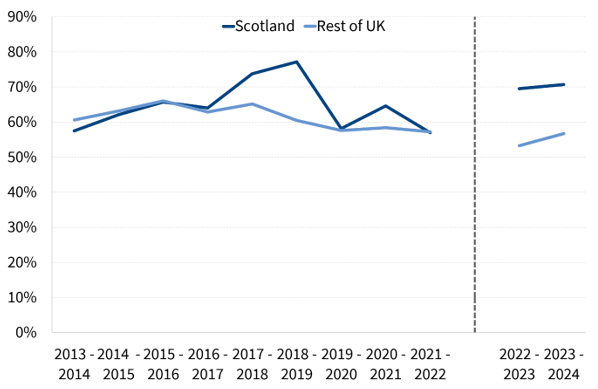
This allows us to understand not only how common it is for young men to be experiencing poverty persistently, but also the extent to which poverty is persistent when it is experienced. Figure 2 shows that poverty among young men has indeed been proportionally more persistent in Scotland than rUK in most years since 2016-2017, with around 70% of young men living in poverty in the latest period also living in persistent poverty.
Figure 2: Proportion of men aged 18-44 in relative poverty who are in persistent poverty
Which young adult men are at greatest risk of falling into poverty – and which are most likely to move out?
One way to understand poverty trajectories is by examining rates of entry and exit. The entry rate represents the proportion of people not in poverty in each period who enter poverty in the following period and can therefore be interpreted as the risk of falling into poverty. Conversely, the exit rate represents the proportion of people in poverty in each period who exit poverty in the following period and can therefore be interpreted as the likelihood of moving out of poverty. These two rates are not easy to compare with each other, but they can be readily compared across groups (because entry and exit rates use different denominators, the exit rate will tend to exceed the entry rate as long as a minority of people are in poverty, even if flows into poverty exceed flows out of poverty in absolute terms).
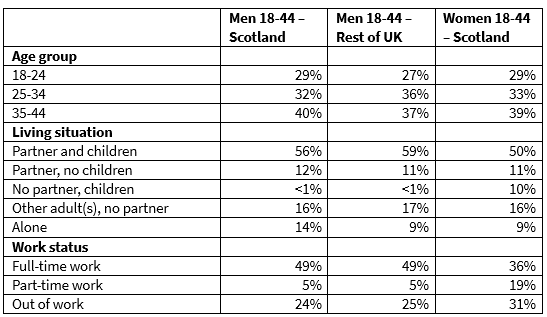
Tables 1 and 2 show poverty entry and exit rates for young adult men in Scotland broken down by age, living situation, and work status, as compared to young adult women in Scotland and to young adult men in rUK. Table 3 sets out the composition of these groups in terms of each of the characteristics.
Turning firstly to age, those aged 18-24 face the highest entry rate, but the risk of entering poverty by no means disappears for older age groups. Furthermore, those aged 35-44 face the lowest exit rate, implying that poverty is more persistent for these individuals when it does occur.
As for living situation, young adult men who are single but living with other adults, such as parents or housemates, face a higher entry rate than those in most other living situations – similar to the rate for lone mothers. These young men also face both a higher entry rate and a lower exit rate than young men in rUK and young women in Scotland who are in equivalent living arrangements. This adds to the finding of our previous report that the increase in poverty among young men in Scotland since the pandemic was driven mainly by an increase in poverty risk among single men living with other adults, who make up around 16% of young men in Scotland. However, these arrangements do not appear to be more common among young men than these two comparator groups overall; and lone mothers face the lowest exit rates of any group. People who live alone also face an elevated entry rate and represent a larger proportion of young men in Scotland as compared to young women in Scotland or young men in rUK.
Finally, in terms of work status, it is part-time workers who demonstrate both the highest entry rate and the lowest exit rate among young men in Scotland. The higher entry rate will partly reflect the fact that those who are out of work will be more likely to be living in poverty already, as well as the relative stability of income that tends to be associated with full-time work. Meanwhile, the lower exit rate implies that part-time workers in poverty struggle to improve their living standards, for example through job progression or movements to full-time work. Again, this group of young men in Scotland face a higher entry rate and a lower exit rate than young men in rUK and young women in Scotland who are working part-time, although young men are considerably less likely to be working part-time than young women in the first place. More generally, young men in Scotland experience lower exit rates than young men in rUK and young women in Scotland when they are working either full-time or part-time, whereas exit rates for those who are out of work are higher in Scotland than rUK for both young men and young women.
Table 1: Poverty entry rates, 2010-2011 to 2023-2024
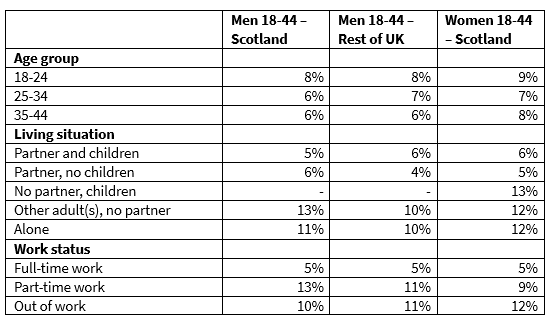
Notes: dash indicates insufficient sample size; pooled longitudinal analysis; poverty defined as having less than 60% of median net equivalised household income after housing costs; entry (exit) rate represents proportion of people not in poverty (in poverty) who move into (out of) poverty in the next period; characteristics are determined in the period before transition; those with missing work statuses are excluded due to lack of information; the considerably higher exit rate of young men compared to young women who are living with a partner and no children reflects a higher exit rate among different-sex couples where the man is 44 or younger while the woman is older than 44; see Annex for further information on how poverty transitions are defined.
Source: SHERU analysis of Understanding Society.
Table 2: Poverty exit rates, 2010-2011 to 2023-2024
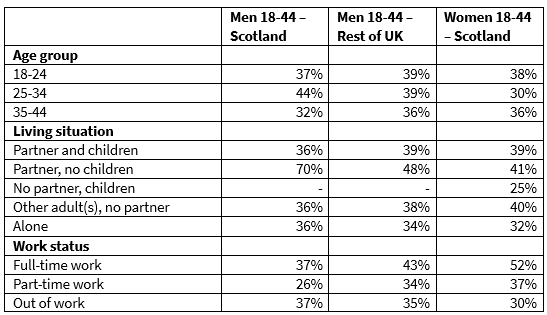
Notes: dash indicates insufficient sample size; pooled longitudinal analysis; poverty defined as having less than 60% of median net equivalised household income after housing costs; entry (exit) rate represents proportion of people not in poverty (in poverty) who move into (out of) poverty in the next period; characteristics are determined in the period before transition; those with missing work statuses are excluded due to lack of information; see Annex for further information on how poverty transitions are defined.
Source: SHERU analysis of Understanding Society.
Table 3: Average composition by characteristic, 2010-2011 to 2023-2024
Notes: average of cross-sectional analysis by wave.
Source: FAI analysis of Understanding Society.
What events push young men into poverty – and what events pull them out?
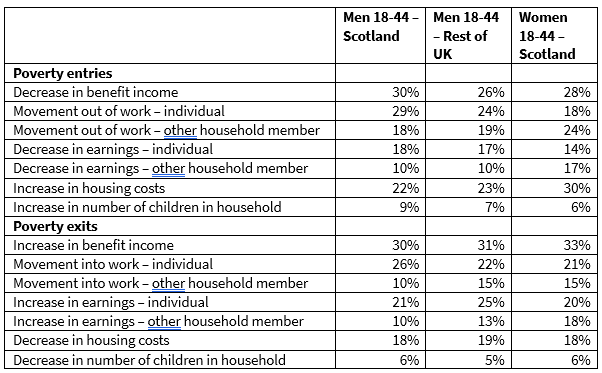
Table 4 shows the proportion of poverty entries and exits that are associated with each of seven key events relating to changes in household income. We refer to these as ‘trigger events’ because they represent proximate causes, rather than the underlying factors and series of events that have led to changes in a household’s circumstances. Note also that these events are not mutually exclusive (multiple events can occur simultaneously) nor are they collectively exhaustive (other events can also happen).
The two events that occur most frequently when young adult men in Scotland enter poverty are the individual moving out of work and the household experiencing a real-terms reduction in benefit income. Conversely, the individual moving into work and the household experiencing an increase in benefit are two the most common trigger events for poverty exits. Real-terms increases in housing costs are also associated with a relatively large proportion of poverty entries, while an increase in the individual’s earnings play a larger role in poverty exits. Overall, labour-market events dominate the picture for both poverty entries and poverty exits.
On the whole, differences in the relative importance of these trigger events between Scotland and rUK are minor, particularly when it comes to poverty entries. The individual moving out of work does represent a noticeably larger proportion of poverty entries in Scotland (29%) than rUK (24%), but the individual moving into work also represents a larger proportion of poverty exits (26% compared to 22%). On the other hand, most other events represent slightly larger shares of poverty exits among young men in rUK than in Scotland.
Differences also tend to be minor when comparing young adult men in Scotland with young adult women. The main difference is that moving out of work and sustaining a fall in earnings make up larger shares of poverty entries among young men when it is the young man himself who has experienced these events, whereas young women are more likely to fall into poverty because someone else in the household has experienced them. However, this pattern is not reflected in poverty exits, where an individual’s own circumstances tend to be more determinative for both young men and young women.
Table 4: Proportion of poverty entries and exits coinciding with trigger events (transition share), men aged 18-44, 2010-2011 to 2023-2024
Notes: events are not mutually exclusive and do not add up to 100%; poverty defined as having less than 60% of median net equivalised household income after housing costs; see Annex for further information on how poverty transitions and trigger events are defined.
Source: SHERU analysis of Understanding Society
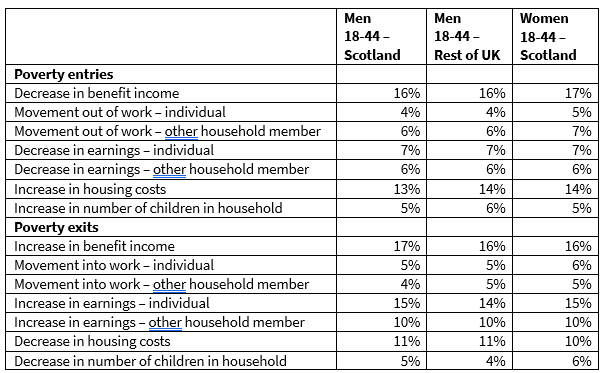
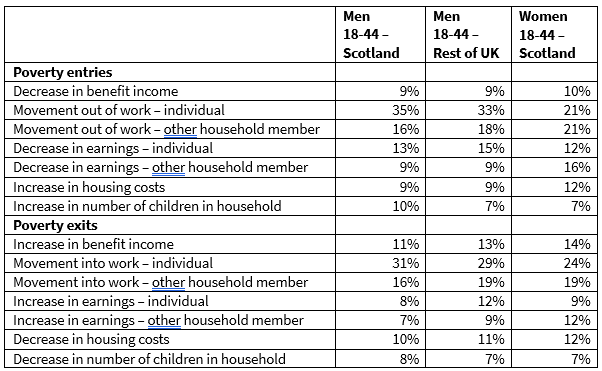
An event can make up a large share of transitions into our out of poverty because it occurs frequently or because it tends to have a large impact on household income when it occurs. Tables 5 and 6 disaggregate these two effects by respectively showing the frequency rate (the proportion of people in poverty who experience an entry trigger or the proportion of those not in poverty who experience an exit trigger, regardless of whether they actually transition) and transition risk (the proportion of people who transition when they experience a trigger event) for each event.
The tables show that movements in and out of work are comparatively rare, with frequency rates of around 5% for young men in Scotland, but are especially impactful when the occur, with transition risks of 30-35% in the case of the individual and around 15% in the case of another household member. On the opposite end of the spectrum, changes in benefit income, as well as earnings, are relatively common but carry relatively low transition risks – particularly in the case of poverty entries. This is an intuitive result, since incomes can fluctuate for many reasons and can be relatively small in magnitude, although very small changes are not counted in this analysis (see Annex).
The second insight from the tables is that frequency rates are nearly identical between young adult men in Scotland and the two comparator groups, with any differences in transition shares driven by different in transition risk. The differences are again most apparent in the case of poverty exits and correspond closely to the differences in transition shares outlined above.
Table 5: Proportion of people eligible for poverty entry or exit experiencing trigger events (frequency rate), men aged 18-44, 2010-2011 to 2023-2024
Notes: events are not mutually exclusive and do not add up to 100%; poverty defined as having less than 60% of median net equivalised household income after housing costs; see Annex for further information on how poverty transitions and trigger events are defined.
Source: SHERU analysis of Understanding Society
Table 6: Proportions of trigger events resulting in poverty entry or exit (transition risk), men aged 18-44, 2010-2011 to 2023-2024
Notes: events are not mutually exclusive and do not add up to 100%; poverty defined as having less than 60% of median net equivalised household income after housing costs; see Annex for further information on how poverty transitions and trigger events are defined.
Source: SHERU analysis of Understanding Society
Discussion
What is this research telling us?
This report has gone beyond static statistics to shed light on the dynamics of poverty experienced by young adult men in Scotland. It has shown, firstly, that persistent poverty is more prevalent among young men in Scotland – and that poverty among this group is more likely to be persistent when it occurs – as compared to young men in rUK on average. This adds to our previous finding that poverty rates among young men have diverged between Scotland and rUK.
The research has also shown that poverty dynamics vary – not only between young men in Scotland and rUK and between young men and women in Scotland, but also between young men with different characteristics. For example, those towards the lower end of the age range are most likely to enter poverty, but those towards the upper end are least likely to exit it, implying that early-adult transitions play a role both in pushing young men into poverty and in pulling them out.
Meanwhile, those who are single and living with housemates or parents are more likely to enter poverty – and no more likely to exit poverty – than those in most other living situations with the notable exception of lone mothers. The problem is particularly pronounced in Scotland as compared to rUK and among men as compared to women, echoing findings from our previous research.(1) We also see meaningful variations by work status, with young men in Scotland who work part-time being particularly likely to enter poverty – and particularly unlikely to exit it. In-work poverty among young men in Scotland appears to be particularly persistent more generally.
At the same time, there remains a strong relationship between entering and exiting work on the one hand and exiting and entering poverty on the other. Changes in benefit income also play a large role in poverty transitions, as do changes in earnings and housing costs – these events will tend to have smaller impacts on household income and are accordingly less likely to move someone across the poverty line when they occur, but this is counterbalanced by the fact that they occur more frequently. Overall, this paints a complex picture in which young men experience a variety of different trajectories.
What are the implications for health inequalities – and for policy?
The higher rate of persistent poverty among young adult men in Scotland as compared to rUK likely contributes to the worse health outcomes that they experience. While the overall prevalence of poverty is important, there is strong evidence that poverty becomes particularly harmful when it is experienced on a persistent basis as disadvantages accumulate. For example, the length of exposure to poverty is associated with poorer mental health in adolescence and young adulthood – as well as other long-term drivers of health inequalities, such as disengagement from the labour market.(6,7)
Another implication that can be drawn from our findings is that policy should avoid focusing exclusively on the younger end of the age spectrum, to the neglect of young men in their mid-twenties, thirties, and forties. While the ages normally associated with transitions into work and independent living carry risks that policy should seek to mitigate, a lack of transitions can be equally detrimental, inhibiting social mobility and ingraining patterns of disadvantage.(8) This is reflected in the health inequalities that young men experience across the age range.(9) Relatedly, our findings point to issues of job quality and progression that especially affect young men in Scotland. This in turn highlights the limits of policy approaches that focus disproportionately on the supply side of the labour market, overlooking the structural inequalities that drive poor outcomes in both employment and health.(10)
A broader finding from this report is that most young adult men who experience poverty experience it persistently – a fact that is also true for the population as a whole.(11) This reflects the way that poverty perpetuates itself through a variety of channels, including health as well as education, housing, and the labour market.(12) On the other hand, a significant proportion of people in poverty do not experience it persistently. This implies that policymakers should focus their efforts on those who are ‘stuck’ in poverty rather than those whose experience of poverty may be transient. Tackling persistent poverty is likely to be especially challenging, but also especially impactful for preventing negative outcomes.
What further research is needed?
References
1. Thompson S. Poverty among young adult men in Scotland [Internet]. Scottish Health Equity Research Unit; 2026 Feb [cited 2026 Jun 22]. Available from: https://scothealthequity.org/poverty-among-young-adult-men-in-scotland/
2. Jenkins SP. Changing Fortunes: Income Mobility and Poverty Dynamics in Britain. Oxford: OUP Oxford; 2011. 430 p.
3. Health Foundation. Relationship between persistent poverty and health | The Health Foundation [Internet]. 2024 [cited 2026 Jun 22]. Available from: https://www.health.org.uk/evidence-hub/money/relationship-between-persistent-poverty-and-health
4. Department for Work and Pensions. Income Dynamics: 2010 to 2024 [Internet]. 2026 [cited 2026 Jun 22]. Available from: https://www.gov.uk/government/statistics/income-dynamics-2010-to-2024
5. NatCen. Wave 14 boost technical report [Internet]. 2024 Oct [cited 2026 Jun 22]. Available from: https://www.understandingsociety.ac.uk/wp-content/uploads/documentation/main-survey/technical-reports/6614-main-survey-boost-technical-report-w14.pdf
6. Udu K, Adjei NK, Akanni L, Niccodemi G, Chen Y, Chua YW, et al. Poverty and family adversity trajectories and not in education, employment or training (NEET) status in late adolescence: evidence from the UK Millennium Cohort Study. BMJ Public Health. 2026 Mar 30;4(1). doi:10.1136/bmjph-2025-003958 PubMed PMID: 10.1136/bmjph-2025-003958.
7. Najman JM, Hayatbakhsh MR, Clavarino A, Bor W, O’Callaghan MJ, Williams GM. Family poverty over the early life course and recurrent adolescent and young adult anxiety and depression: a longitudinal study. Am J Public Health. 2010 Sep;100(9):1719–23. doi:10.2105/AJPH.2009.180943 PubMed PMID: 20634459; PubMed Central PMCID: PMC2920957.
8. Colin Webster DS. Poor transitions [Internet]. Bristol: Policy Press; 2004 [cited 2026 Jul 4]. Available from: https://policy.bristoluniversitypress.co.uk/poor-transitions
9. Catalano A, Congreve E, Jack D, McHardy F, Smith K. 2025 Inequality Landscape [Internet]. 2025 Sep [cited 2025 Dec 6]. Available from: https://scothealthequity.org/inequality-landscape-2025/
10. Thompson S. Assessing Scotland’s approach to employability from a health inequalities perspective. Scottish Health Equity Research Unit [Internet]. 2026 May 1 [cited 2026 Jun 22]. Available from: https://scothealthequity.org/assessing-scotlands-approach-to-employability-from-a-health-inequalities-perspective/
11. Scottish Government. Persistent poverty in Scotland 2010-2024 [Internet]. 2026 Mar [cited 2026 Jun 24]. Available from: https://www.gov.scot/publications/persistent-poverty-in-scotland-2010-2024/
12. De Schutter O. The persistence of poverty: how real equality can break the vicious cycles – Report of the Special Rapporteur on extreme poverty and human rights [Internet]. United Nations; 2021 Jul [cited 2026 Jun 24]. Report A/76/177. Available from: https://www.ohchr.org/en/documents/thematic-reports/a76177-persistence-poverty-how-real-equality-can-break-vicious-cycles
13. Lai ETC, Wickham S, Law C, Whitehead M, Barr B, Taylor-Robinson D. Poverty dynamics and health in late childhood in the UK: evidence from the Millennium Cohort Study. Arch Dis Child. 2019 Nov;104(11):1049–55. doi:10.1136/archdischild-2018-316702 PubMed PMID: 31186294; PubMed Central PMCID: PMC6837248.
14. Scottish Government. Growing up in Scotland: the circumstances of persistently poor children [Internet]. 2010 Apr [cited 2026 Jun 22]. Available from: https://www.gov.scot/publications/growing-up-scotland-circumstances-persistently-poor-children/
15. Joseph Rowntree Foundation. UK Poverty 2026 [Internet]. 2026 Jan [cited 2026 Jul 4]. Available from: https://www.jrf.org.uk/uk-poverty-2026-the-essential-guide-to-understanding-poverty-in-the-uk
16. Bania N, Leete L. Monthly income volatility and health outcomes. Contemp Econ Policy. 2022;40(4):636–58. doi:10.1111/coep.12580
17. Social Metrics Commission. Social Metrics Commission 2018 Report [Internet]. 2018 Sep [cited 2026 Jun 22]. Available from: https://socialmetricscommission.org.uk/social-metrics-commission-2018-report/
18. Fisher P. Does repeated measurement improve income data quality? – Institute for Social and Economic Research [Internet]. 2016 Oct [cited 2026 Jun 22]. (ISER Working Paper Series; nos 2016–11). Available from: https://www.iser.essex.ac.uk/research/publications/working-papers/iser/2016-11
Annex
Data
The analysis is based on Understanding Society data from Wave 2 to Wave 15, with Wave 1 excluded for quality reasons.(18)
Persistent poverty is measured using four rolling waves, meaning the first measurement is for Wave 5 (covering Waves 2, 3, 4, and 5) and the last measurement is for Wave 15 (covering Waves 12, 13, 14, and 15). Longitudinal weights are used for this analysis.
On the other hand, as transition rates and trigger events are measured using pairs of waves, the first measurement is in Wave 3 (covering Waves 2 to 3) and the last measurement is in Wave 15 (covering Waves 14 and 15). The results of these analyses represent pooled longitudinal analysis, meaning they include all transitions within this timespan. Longitudinal weights are again used, but these are grossed to the average UK population of the two calendar years in each wave to ensure that waves with larger populations are weighted proportionately more.
Cross-sectional weights are used to calculate population breakdowns. This analysis is averaged rather than pooled.
Definitions
Characteristics are always defined in the first period of measurement. For example, for persistent poverty in Wave 15, characteristics are defined in Wave 12, while for poverty transitions in Wave 15, characteristics are defined in Wave 14.
A poverty transition is only defined as such if the household clears the poverty line in either direction by at least 10%. That is, a household is counted as moving out of poverty if its income is below the poverty line in the first wave and at least 10% above the poverty line in the second wave.
In terms of trigger events, changes in income and housing costs are only counted when they amount to an absolute change of at least £10 per month and, unless starting from zero, a percentage change of more than 20%. Additionally, a change in benefit income is only counted as a trigger event if the number of children and the number of adults in the household both remain unchanged, while a change in an individual’s own earnings is only counted if the individual remains in work and a change in another member’s earnings is only counted if the total number of workers in the household remains unchanged.