The impact of the pandemic on savings and debt: did the experience of Scotland differ from the rest of Great Britain?
A PDF version of this article can be read here.
Introduction
Wealth can play an important role in shaping health outcomes. Unlike income, which reflects current resources, wealth captures longer-term financial security and can give a good indication of whether households will be resilient to shocks such as illness, job loss, or rising living costs.
Households with greater wealth are better able to absorb unexpected expenses, maintain stable housing, and access goods and services that support good health, including nutritious food, warm homes, and opportunities for rest and recovery[i]. Conversely, low wealth or debt can increase financial stress and insecurity, which are strongly associated with poorer mental and physical health outcomes, reinforcing existing socioeconomic inequalities[ii].
In 2025, the Office for National Statistics released new figures on wealth and indebtedness from their regular Wealth and Assets Survey[iii], covering Great Britain (Northern Ireland isn’t included in this survey) for the period 2020-22. Wealth is made up of four categories: property wealth, physical wealth (i.e. moveable items such as cars), pension wealth, and financial wealth, which includes savings. Financial wealth provides the easiest (i.e. most liquid) place to turn in times of low income. The Wealth and Assets survey also reports on debt holdings, both secured and unsecured.
Our analysis uses a methodology adapted from a Resolution Foundation report that looked at data on savings and debt in Great Britain during the pandemic (see Background section). In our analysis, we compare Scotland to GB figures. We find that:
Savings
· In common with households in Great Britain, there is evidence that lower-income households in Scotland were able to build savings during the pandemic.
· The data indicates that households with lower-than-average income in Scotland may have experienced a relatively stronger improvement in savings compared with the GB average.
· In both Scotland and GB, lower income households are still much less likely to hold a significant amount of savings compared to higher income households.
Debt
· The GB data shows that households across the income distribution paid down unsecured debt during the pandemic.
· However, in Scotland, the data indicates that the poorest 40% of households instead accumulated more unsecured debt.
· The lowest income households (poorest 20%) also reported a rise in ‘unmanageable’ debt.
Background
The Resolution Foundation report ‘Before the Fall’ analyses savings and debt trends across the income distribution over the course of the pandemic for Great Britain. The title of their briefing refers to the fact that the update to the Wealth and Assets Survey only takes us up to the end of the 2021/22 financial year, a period which was followed by several years of high inflation and the ‘cost of living crisis’. We will have to wait a couple of years for data that covers this period.
The pandemic period was a health crisis combined with an unprecedented economic shock. Governments across the UK put in place mitigations, such as the furlough scheme, to try and limit the impact on the economy and household incomes for those with jobs most affected by lockdown. The periods of lockdown also severely reduced spending opportunities and, bearing in mind that income for many households was not affected by the pandemic (for example, for those whose work continued but from home), this set of circumstances meant that, on aggregate, households were able to accumulate savings and pay down debt. The Resolution Foundation found that, overall, household wealth rose sharply during the pandemic but with variation across the income distribution – households with higher income were able to save more and pay off more debt than lower income families.
While the Resolution Foundation’s analysis focused on Great Britain as a whole, we wanted to examine whether those trends also hold true for Scotland when considered separately. We look at savings and debt in turn and analyse trends in Scotland compared to Great Britain.
A note on the data
The Wealth and Assets Survey covers private households across the whole of Scotland and is representative at the national level. Nevertheless, we have to be mindful of the Scottish sample size. The Scottish Government advise that:
“For estimated proportions or median amounts, the sample of the underlying base has to be at least 30 cases, for example 30 interviewed people, or 30 interviewed households (depending on the question). Where sample sizes are too small to produce a robust estimate, the estimate will be suppressed.”
In addition, the most recent wave of the Wealth and Assets Survey had its National Statistics designation removed because the Office for National Statistics (ONS) identified quality and coherence concerns linked to pandemic-related disruption[iv]. Data collection for the 2020–22 period was heavily affected by COVID-19, with a shift away from face-to-face interviewing, lower response rates, and changes in who was able or willing to participate.
The Resolution Foundation’s analysis looks at two periods: pre-pandemic 2019-20 and post pandemic 2021-22 for Great Britain. The years 2020–21 are purposely left out of the analysis, removing the volatility associated with the core pandemic lockdown period[v].
Only non-pensioner households are included to remove the bulk of the retired population who look very different from the working age population: they will have much lower income than the working age population and will be more likely to be drawing down savings.
Whilst both of these modifications make logical sense for comparisons over time, they have the effect of reducing the sample size even further. We have followed the Scottish Government’s advice on minimum sample sizes when conducting our analysis, meaning we could not replicate all of the analyses in the Resolution Foundation report.
The Resolution Foundation made one further methodological choice that we could not replicate. They used a longitudinal approach meaning that they only included families that were in the survey in both 2019-20 and 2021-22 and looked at how savings and debt changed for those families. Replicating this analysis for Scottish families would require access to data held under special licence. Whilst it is possible to apply for use of this special license, it would mean our analysis would be more difficult for others to replicate. It would also have limited the Scotland sample even further. We’ve therefore decided to analyse the full cross-sectional dataset for 2019–20 and 2021–22 using end-user licence data available from the UK Data Service.
This decision to use end-user license data also required us to use household level data, rather than family (or benefit unit data). Often, there is no difference between households and benefit units, but in some situations, for example where adult children live with parents, you could have two benefit units within the same household. However, even in the Resolution Foundation analysis, the income stratification depends on household income, rather than benefit unit income. In some ways, it is therefore preferable to analyse savings and debt at a household level, given that we are most interested in how these components of wealth can be used as a buffer against low income.
Rather than comparing Scottish figures directly to the GB figures in the Resolution Foundation’s report, we compute our own GB cross-sectional results that are more comparable with our methodology for Scotland. We have also compared these to the Resolution Foundation’s longitudinal analysis for GB, and comment on where this changes the interpretation of the Resolution Foundation’s original findings.
Savings through the pandemic
According to the Resolution Foundation and other data sources, overall savings rose during the pandemic, reaching a record high of 25 percent of disposable income in Q2 2020. Rather than having to dip into savings, the impact of reduced spending opportunities due to restrictions appears to have outweighed any reduction in income due to furlough or job losses.
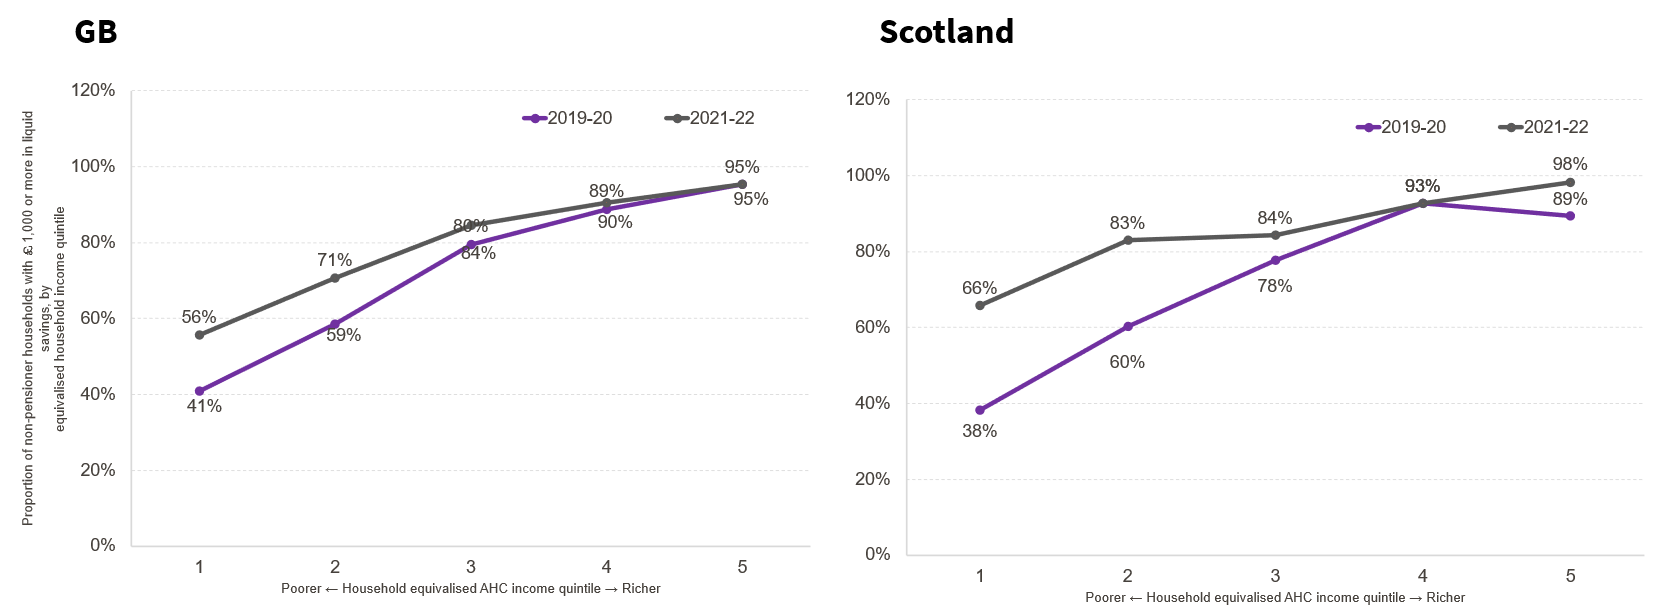
The Resolution Foundation tracked the same families in the Wealth and Assets survey over the pandemic period and found that the proportion of non-pensioner families with £1000 or more in liquid savings increased across the income distribution:
“In particular, the proportion of families in the bottom income quintile with £1,000 or more in ‘liquid’ savings – defined as current accounts in credit, money in savings accounts, value of ISAs, money in National Savings & Investments (NS&I) and cash savings –increased from 35 per cent in 2019-20 to 44 per cent in 2021-22. Smaller improvements in financial resilience were observed among higher income families, but that is primarily because financial resilience was already high”
We can see similar trends in the GB data when looking at the 2019-20 and 2021-22 cross-sections of household data and a very similar trend for Scotland. It is important not to read too much into the exact figures in the Scottish data when there are concerns over accuracy of the Wealth and Assets survey, however, there does seem to be a bigger uplift in savings for those in the lowest two quintiles in Scotland compared to the the GB average.
It is also important to note that an income gradient is still apparent post-pandemic in Scotland and GB – higher income households are still much more likely to hold significant savings than lower income households.
Figure 1: Proportion of non-pensioner households with £1,000 or more in liquid savings, by equivalised income quintile
Debt through the pandemic
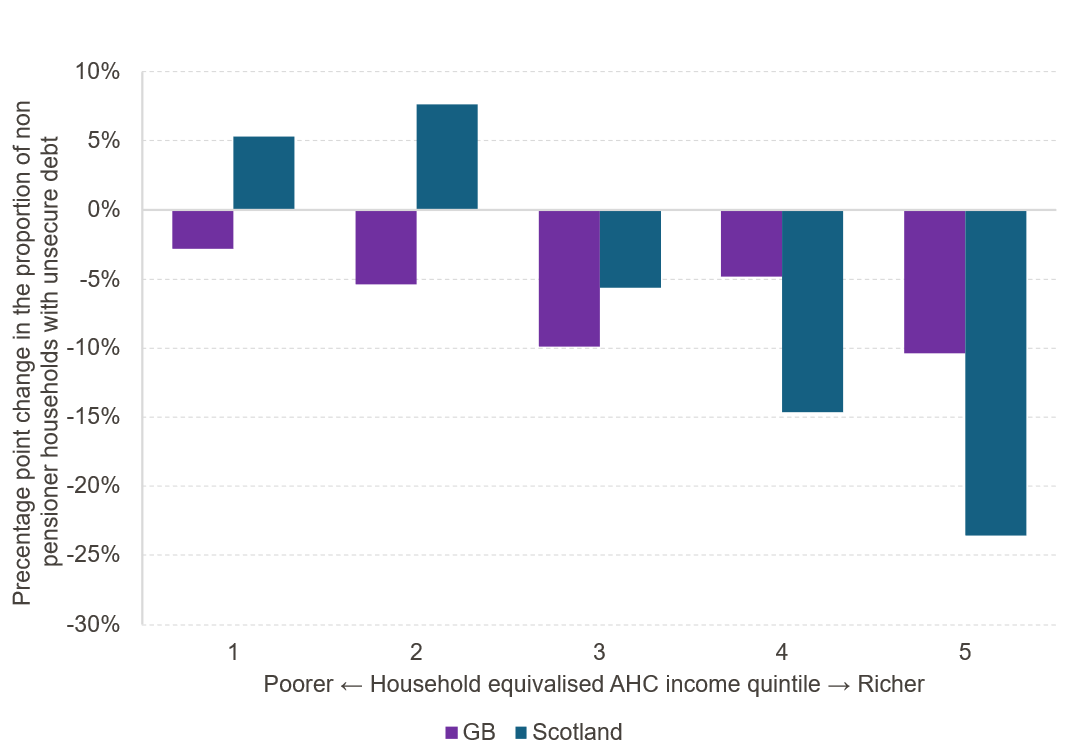
The Resolution Foundation reference data from the Bank of England showing large falls in aggregate consumer credit over the pandemic period. To look at trends across the income distribution, the Resolution Foundation combine a number of variables from the Wealth and Assets Survey to produce their definition of unsecured debt encompassing credit cards, outstanding mail order balances, hire purchases, loans (excluding mortgages and student loans), overdrafts on current accounts and bill arrears. As with savings, they compare the same families in 2019-20 and 2021-22.
They found that around the same proportion of families in the two lowest income quintiles saw their unsecured debt decrease as increase over the period, leaving the overall proportion of families with unsecured debt in these quintiles unchanged.
Our cross-sectional analysis finds that, for Great Britain, there is a small reduction in unsecured debt in every income quintile, with the smallest reduction in the lowest income quintile and the largest reduction in the middle and top income quintiles. This is a slightly different result than the Resolution Foundation find in their longitudinal analysis but follows a similar income gradient (those with lower incomes saw a lower reduction in debt).
The results for Scotland again show an income gradient, but with a slightly different finding for those at the bottom of the income distribution where we saw an increase in the proportion of households holding unsecured debt and much larger falls in debt for richer households.
Figure 2: Percentage point change in the proportion of non-pensioner households with unsecure debt
These GB and Scottish trends look quite different and, given concerns over the quality of the data, it is helpful to look at other analyses using slightly alternative measures of debt to see whether the same trend is apparent.
In the Scottish Government’s analysis of the Wealth and Assets survey, they look at ‘unmanageable debt’:
“a household is in unmanageable debt if they have liquidity problems or solvency problems, or both. Liquidity problems mean people struggle with their debt repayments and are falling behind with bills. Solvency problems mean people have a large amount of debt and feel heavily burdened by it”
This is a useful measure as it gives us an indication of how concerned policy makers should be by a change in unsecured debt. For example, the increase in savings in lower income households as shown in Figure 1 may mean that an increase in unsecured debt may still be “manageable” for the household and therefore not a cause for concern.
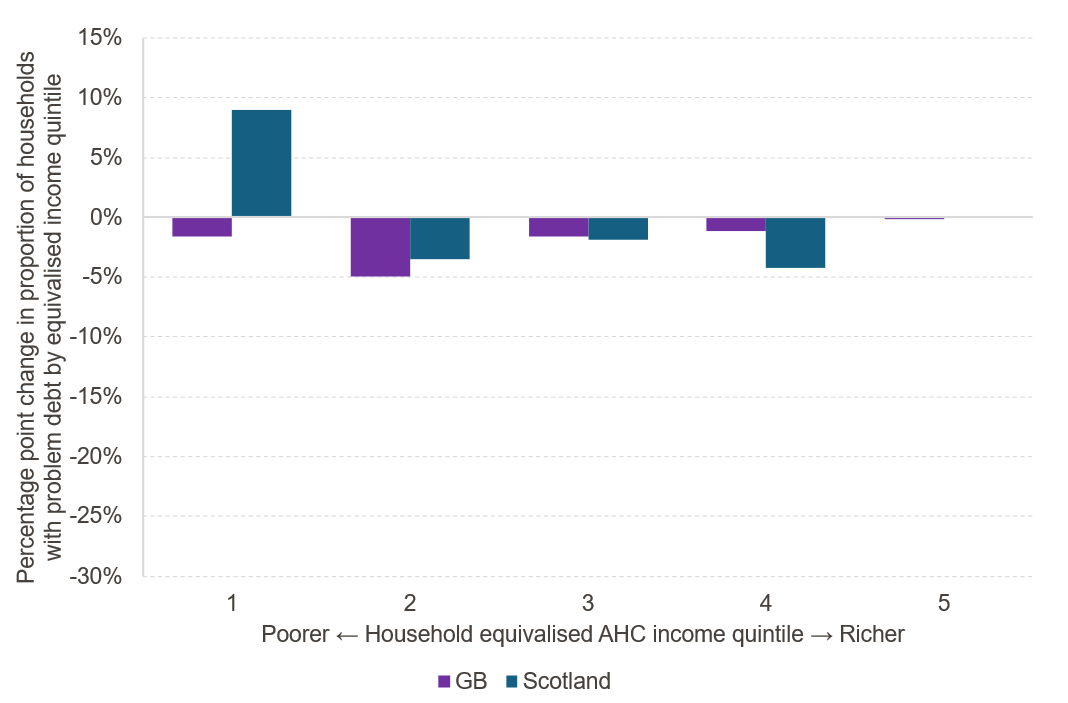
The Scottish Government analysis shows an increase in unmanageable debt for the lowest income quintile in 2020-22 compared to 2018-20, but a reduction for the second income quintile.
The Scottish Government analysis is a little different as it includes pensioners and does not limit the financial years included in the data. However, our analysis of unmanageable debt with pensioners removed and limited to 2019-20 and 2021-22 produces similar findings. We also repeated this analysis for the whole Great Britain sample and find that Scotland and GB see similar outcomes for reductions in unmanageable debt for the second, third and fourth income quintile.
However, as Figure 3 shows for the first (lowest) income quintile, there is a clear difference between Scotland and the GB average with a small fall in problem debt in the GB average, but a notable rise in Scotland. This suggests that the rise in unsecured debt shown in Figure 2 may have been “manageable” for those in the second income quintile, but not for those in the first (bottom) income quintile.
Figure 3: Percentage point change in the proportion of non-pensioner households with unmanageable debt
The Resolution Foundation look at components of unsecured debt in their longitudinal analysis. The type of unsecured debt where there seemed to be a growing issue for families in the lowest income quintile was bill arrears. This could include public debt such as Council Tax debt. Unfortunately, sample sizes are too small to allow us to look at this in Scottish data.
Conclusions
Overall, the evidence suggests that the pandemic period was associated with an improvement in household balance sheets, with rising savings and falling debt on aggregate, and Scotland broadly followed the same pattern as Great Britain. However, this headline picture masks important inequalities.
While lower-income households in Scotland appear to have built some additional liquid savings during the pandemic, and more so than the GB average, those at the very bottom of the income distribution also experienced a worsening position in terms of debt, particularly unmanageable debt. This latter point contrasts with the Great Britain average and may point to greater financial vulnerability among Scotland’s lowest-income households. It is important to note that concerns over the he quality of the data makes it difficult to be confident in this conclusion.
Additional qualitative and comparative evidence across the UK would be beneficial for validating the results of this analysis.
Setting aside the differences between the Scottish and GB data, inequalities remain in both Scotland and GB between the lowest and highest income households in terms of savings and debt. Pandemic-era gains in financial resilience are likely to have been uneven and wealth-related inequalities remain a key channel through which health and socio-economic inequalities are likely to persist, especially as households moved into the subsequent cost-of-living crisis.
References
[i] Pollack, C.E., Chideya, S., Cubbin, C., Williams, B., Dekker, M. and Braveman, P. (2007) ‘Should health studies measure wealth? A systematic review’, American Journal of Preventive Medicine, 33(3), pp. 250–264. https://doi.org/10.1016/j.amepre.2007.04.033
[ii] Richardson, T., Elliott, P. and Roberts, R. (2013) ‘The relationship between personal unsecured debt and mental and physical health: a systematic review and meta-analysis’, Clinical Psychology Review, 33(8), pp. 1148–1162. https://doi.org/10.1016/j.cpr.2013.08.009
[iii] Office for National Statistics. (2019). Wealth and Assets Survey . [data series]. 2nd Release. UK Data Service. SN: 2000056
[iv] Office for Statistics Regulation (OSR) (2025). Statistics from the Wealth and Assets Survey. Available at: https://osr.statisticsauthority.gov.uk/publication/statistics-from-the-wealth-and-assets-survey/ (Accessed: 16 January 2026)
[v] We note that limiting the sample in this way may have impacted on the representativeness of the sample given that Wealth and Asset survey weights are derived from the full survey period. The impact is likely to be small, and we cannot see any mitigation or discussion of this in the Resolution Foundation report, so any errors are assumed to be present in their analysis as well as this SHERU report.