Rethinking Labour Market Statistics in Scotland
This report focuses on the alternate estimates and illustrates this using charts for Scotland, but we have also modelled labour market statistics for all Scottish local authorities. These can be found in a data dashboard available here.
View this report as a PDF here
View the technical appendix as a PDF here
If you would like more information, including the underlying data included in this report and data dashboard or a Stata replication file, please contact us at sheru@strath.ac.uk.
Introduction
Employment is a key socioeconomic determinant of health inequality in Scotland [1]. The relationship between work and health is multifaceted. Employment status, job quality, and other aspects of work have huge implications for health; in turn, poor health affects the types of work a person can do, the workplace adjustments they may require to be in the workforce, and whether or not they work at all.
Understanding what is happening in the labour market is therefore key to designing economic policy and key services like employability. Labour market statistics influence funding allocations for local services and planning for how these services are delivered, making high-quality labour market statistics of great importance to national and local policymaking.
Official UK and Scotland-level labour market statistics on employment, unemployment, and economic inactivity are derived from the quarterly Labour Force Survey (LFS). The Annual Population Survey (APS) is an annual version that combines several LFS quarters; until the last quarter of 2025, it also included a boosted sample to improve sample sizes. The APS is intended to provide enough information to produce estimates of key labour market statistics at lower geographic levels like local authorities or for smaller population groups, such as people with disabilities or the reasons behind economic inactivity.
In recent years, however, the quality of these statistics has fallen [2]. This is largely due to a reduction in the response rates, and subsequently, of the achieved sample size of the survey. The decline followed the pandemic, starting in the latter half of 2021 and reaching its lowest point in the third quarter of 2023 [3]. This decline was the acceleration of a trend that was apparent prior to the pandemic, and one seen in many countries internationally.
These issues, in addition to delayed reweighting of the APS to match Census population estimates, led to the removal of the “official statistics” designation from many statistics derived from the LFS and APS. Statistics that had this designation removed include the Scottish Government’s Labour Market Update series and the ONS’s regional labour market publication [4]. A quality assessment by Scottish Government showed a reduction in achieved sample sizes and reduced levels of confidence in local authority-level statistics derived from the APS [5]. In December 2024, the ONS reweighted the LFS going back to 2019, but did not apply the same reweighting to the APS, meaning that, although derived from the same source data, these two surveys show diverging labour market estimates. In 2025, response rates and sample sizes rebounded, but the quality of many local estimates remains low.
Over this period, the conclusions drawn from the survey data were quite different to those based on administrative tax data published by HMRC. Tax data on payrolled employment suggested that the number of employees in the UK had risen, while the LFS and APS suggested that employment was declining.
All of this has led to a variety of stakeholders seeking alternatives to the LFS data for insights into labour market dynamics, including the Scottish Government [6]. The urgency of this has increased with the announcement that the Scottish Government will no longer fund a Scottish boost sample [7], leading to a further drop in quality for local authority-level statistics. Based on a simulation exercise conducted by the Scottish Government [7], about one-third of local authority-level estimates may no longer be considered robust after the removal of the boost sample, particularly local inactivity estimates.
Recent developments in administrative data offer alternatives to survey data for local authority-level labour market estimates. This report expands on our previous modelling of the labour market using administrative tax data combined with information from the Census and the APS [8]. We create alternate estimates of the headline labour market statistics for Scotland and for all Scottish local authorities: employment, unemployment, and economic inactivity.
Key findings
The reliability issues with the LFS and APS, which we have previously noted at the national level [8], are heightened at the local authority level [5], where labour market data is an input to funding allocations and decisions about economic and employability policy.
In an update to our modelling from last year, we find that the APS shows a misleading trend in working-age employment in Scotland in recent years, as well as noticeably spurious trends for some local authorities like Orkney.
Our new modelling suggests that working-age employment in Scotland has slowly declined since late 2023, accompanied by a rise in economic inactivity. Trends for specific local authorities vary but are often not well-represented by APS estimates.
The method we use provides one alternative to the APS for local authorities looking to better understand trends in the labour market. As methods like ours develop, including Scottish Government efforts to fill gaps in labour market data from alternative sources [6], we emphasise the importance of communicating the quality of labour market data to decision-makers in local authorities.
Where the numbers come from
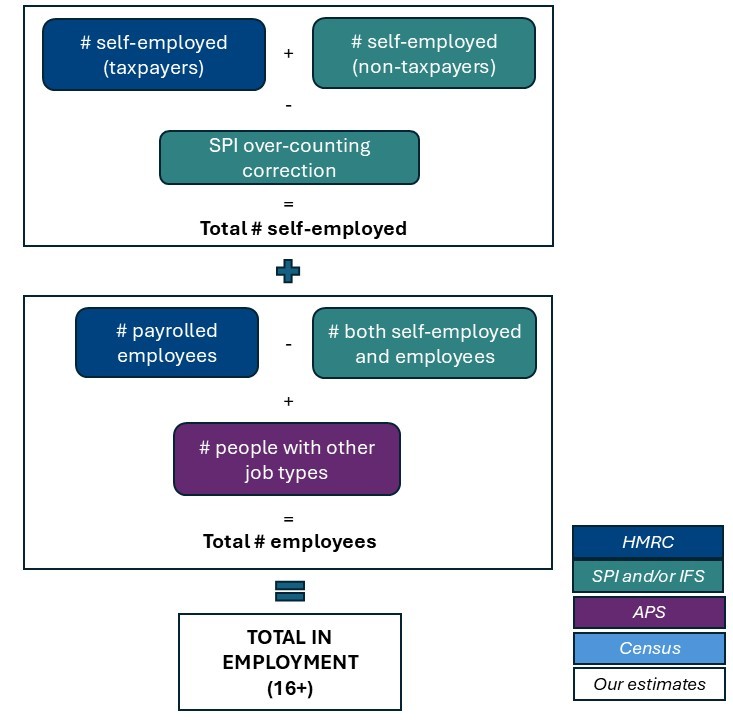
The first step to an alternate set of labour market statistics is constructing a reasonable measure of total employment. The basis for this measure is employee and self-employed taxpayer statistics from HMRC. These are then adjusted to account for:
- Self-employed non-taxpayers
- People who are both employees and self-employed
- Known over-counting of self-employed people in the Survey of Personal Incomes pre-2018/19 [9]
- People who have job types that are not captured in tax data (e.g., people working for family businesses)
The result is a measure of the number of people over 16 in employment. This process is summarised in Figure 1, colour-coded by the source of the data.
We adjust again by the employment rate of those over 65 to obtain a measure of employment for working-aged people (16-64).
Once we have an estimate for employment, we subtract this number from the whole population and split the remaining non-working population into those who are unemployed and those who are economically inactive*. The split is based on a ratio of unemployment to inactivity in the APS. This is carried out both for ages 16-64 and 16+.
Most of the data we use is at the local authority level. However, some information (like the proportion of self-employed people who do not pay tax) is only available for Scotland as a whole.
The methodology used to produce our labour market estimates is discussed in more detail in the technical appendix to this report.
Figure 1: Process of obtaining labour market estimates from administrative data
* Unemployment refers to people who are not in employment but are actively seeking work and ready to start in the next few weeks. Economic inactivity refers to those who are not in employment and not seeking work, or who are seeking work but not ready to start in the next few weeks.
What the administrative data model shows
Our estimates for employment in Scotland are shown in Figure 2 below. The LFS employment count is also shown for context*.
Despite greater variability in the LFS data, the two data sources show somewhat similar trends for most of the period from 2014 until the end of 2022. Compared to the LFS, the administrative data model shows a smoother series and a slightly deeper drop through the pandemic.
Figure 2: Employment in Scotland (16-64), 2014-2025
Source: SHERU and Nomis
Past late 2023, the two series show somewhat different trends. The LFS suggests that employment fell again in 2024, then rose until the end of 2025. The administrative data show continued growth post-pandemic until the end of 2023, then a slight decline in employment through the end of 2025. They also imply different things about the pandemic recovery; the LFS data suggests that employment is only just at (or even a bit below) pre-pandemic levels, while the administrative data show a higher level of employment post-pandemic.
These differences carry over to measures of inactivity and unemployment.
Where the LFS shows largely lower inactivity, and falling inactivity since mid-2024, estimates based on administrative data shows a rise.
Unemployment estimates from both series track more closely, but the modelled estimates suggest lower unemployment from the end of 2022 and a rise over the last year, where the LFS shows a spike in unemployment that has since declined (Figures 3a and 3b).
Figure 3a: Inactivity in Scotland (16-64), 2014-2025
Figure 3b: Unemployment in Scotland (16-64), 2014-2025
Source: SHERU and Nomis
Ultimately, the two data sources cast a very different view of Scotland’s labour market performance over the last two years, particularly for employment and inactivity. The LFS shows an improving picture in recent quarters, while the estimates based on administrative data shows a slight decline in employment and potentially worrisome rise in inactivity.
* The LFS is the preferred source for Scotland-level labour market statistics, largely due to differences between the LFS and APS population sizes and weights. When we discuss local authorities, we switch to APS comparisons, since that is still the preferred source for local area statistics. While confidence intervals are published for APS estimates on Nomis, they are not provided for LFS estimates, so we are not able to include them in charts reflecting LFS estimates.
Reasons for differences
Data coverage and definitions
There are legitimate reasons why administrative data on payrolled employment and self-employment and the LFS/APS would show different employment counts, some of which are:
· They are different types of data. Statistics derived from surveys have greater variability because they are based on a sample of the population, whereas administrative data directly observes most people in the population of interest. This is one reason why employment trends derived from the LFS/APS tend to be more variable.
· They cover different populations. The LFS and APS, by design, cover only people living at private addresses in the UK. That is, it excludes people living in most types of communal establishments like medical establishments, prisons, or temporary accommodation, which would be covered in HMRC’s tax data. HMRC tax data may also include non-UK-residents who would not be surveyed by the LFS/APS. On balance, though, these are relatively small proportions of the UK population. The LFS and APS themselves also have different population sizes due to differences in weighting. The gap between the NRS, LFS, and APS populations has grown since 2021; although the difference between the NRS and LFS populations should be approximately the number of people living in communal establishments, in practice the gap has grown wider than is supported by Census data. We go into more detail on how this affects our estimates in the technical appendix.
· Who they consider ‘in employment’ is slightly different. HMRC’s tax data is based on who is paid through payroll (for employees) and who earns enough to file a tax return (for the self-employed). Where we make an adjustment to account for non-taxpayers and types of employment not covered by tax data, the LFS/APS directly captures people with earnings below the lower earnings limit for tax. Furthermore, the LFS/APS is collected by survey, and allows for a more subjective assessment of whether people consider themselves employed.
These differences are relatively small and unsurprising, but we would still expect the two series to show broadly the same trend.
Differences in measured self-employment
In both our modelling and the APS, employment can be divided into self-employment and employees. The same comparison cannot be made with published LFS statistics, which do not include this breakdown.
When we split out types of employment, the largest differences between our model and the APS are in self-employment (Figure 4b) – which is also where the relative accuracy of the administrative data versus the LFS/APS is the least clear-cut.
Figure 4a: Employee counts (16+), Scotland, 2014-2025
Figure 4b: Self-employment counts (16+), Scotland, 2014-2025
Source: SHERU and Nomis
Notes: Modelled employee and self-employed counts are SHERU estimates that include the adjustments to the original HMRC data shown in Figure 1.
Barring the last two years, the employee figures track reasonably closely and show the same trend across the two sources.
In self-employment over the same period, however, the figures differ by quite a lot. This may be down to the intermittent nature of some self-employment; where administrative tax records capture any self-employment income above the taxable threshold in the given tax year, the LFS/APS will only capture someone who identifies as being self-employed and having worked in the last week.
Trends in both employee counts and self-employment are different across the two data sources since the pandemic. The employee statistics follow a similar pattern to the overall employment statistics discussed in the previous section.
Short-run changes in self-employment are also difficult to capture in administrative data, which is published by tax year, where employee data can be published monthly.
Some of the lack of movement in the administrative self-employment statistics is also attributable to the long lag in the publication of self-employment data by HMRC – statistics for 2023-24 were just published in April 2026. We simply carry forward the most recent self-employment counts to feed into the later quarters of the model, which may not reflect recent dynamics. That said, there is still a large gap in measured self-employment between estimates based on HMRC’s administrative data and the APS for the period where we do have tax data, and it is much larger since the pandemic than before.
These differences highlight that self-employment is a key area for future data improvements that would help us understand the labour market.
What does administrative data tell us about local labour markets?
A central issue arises when we see large differences, and a difference in key trends, between the survey and administrative data as we do from late 2022 onwards. The problem is compounded at the local authority level, where the APS estimates become less reliable and even more variable [5].
The APS is comprised of four quarters of LFS responses, plus a boost sample. It is an important source of labour market statistics for local authority decision-making and Scottish Government’s resource allocation. For instance, labour market statistics from the APS form an important input into Scottish Government’s allocation of employability funding, and local employability service planning relies on understanding trends and levels of inactivity and unemployment.
The nature of surveys means that local authority-level data is more variable than at Scotland level because it is based on interviews with fewer people. While the APS is intended to be representative at a local authority level, there are clearly issues in some smaller areas.
One of these is illustrated in Figure 5, which shows employment statistics for Orkney.
Figure 5: Employment in Orkney Islands (16-64), 2014-2025
Source: SHERU and Nomis
Administrative data shows reasonably steady employment, starting at around 12,000 people in 2014 and declining slowly to just over 11,000 by the end of 2025.
The APS, however, shows a huge drop in employment between the end of 2023 and the beginning of 2024 to around 1,000 people. This is clearly an issue with the underlying survey weights (the way the survey translates individual responses into a population-level statistic), rather than a real shift in employment.
This is one of the most egregious examples, taken from a local authority with one of the smallest APS sample sizes in Scotland. Larger local authorities have larger sample sizes and may still get a reasonably accurate picture of their labour markets from the APS. However, it is important that local authorities understand how their area’s sample size and the quality of the APS have shifted over time, and that they have access to alternatives where available.
In other cases, the value of administrative data is that it is less “noisy” (has fewer random jumps up and down) than survey data, again due to the sampling-based nature of the latter.
For instance, the APS data for East Renfrewshire since the pandemic is fairly noisy, making it difficult to interpret the trend, whereas the modelled administrative data shows a much smoother trend (Figure 6).
Figure 6: Employment in East Renfrewshire (16-64), 2014-2025
The APS data seem to show that the labour market is more volatile in East Renfrewshire post-pandemic. Given the additional administrative data, however, it seems more likely that the APS data just shows noise around an increasing trend.
These are some examples of how administrative can provide a clearer picture of trends in local authorities and reduce the risk of basing policy decisions on short-run fluctuations rather than real labour market conditions. However, it’s difficult to discuss all the differences for each local authority in one report. To explore all our local authority-level statistics, visit our dashboard.
Limitations of our approach
As with any data source, there are limitations to using administrative data in understanding the labour market. General limitations, and those specific to our approach, are discussed below.
High-quality, timely statistics from payroll tax data have made it easier to track trends in employee counts – but self-employment data hasn’t seen the same improvements. The PAYE RTI system makes it relatively simple and quick for HMRC to publish statistics on payrolled employees each month (subject to revisions*), but self-employment statistics are based on tax returns which may need a long time to process and publish after the tax year concludes. The self-employment statistics we use are already at least two years old, and we simply carry forward the last available year’s values to the end of the modelled period – meaning that short-term changes in self-employment aren’t reflected in our estimates. These inaccuracies can carry over to our estimates of inactivity and unemployment. Furthermore, local authorities with a higher proportion of self-employment may have less accurate estimates from administrative data due to the self-employment data lag.
Large changes in labour market trends among those over 65 may cause our estimates to misrepresent statistics for the working-age population. Our approach estimates employment for everyone over 16, then uses proportions of those over 65 who work from the Census for each local authority to get an estimate of employment for the working-age population. If a lot of people over 65 have suddenly moved in or out of work in a given area**, that won’t be reflected in our estimates, and we might over- or under-estimate working-age employment as a result. This issue becomes more relevant as the time since the last Census increases.
We still rely on the APS for splitting the non-working population into inactive and unemployed. Our estimates for these measures are therefore subject to the same issues as the APS, although we try to minimise some of this by using the ratio of inactivity to unemployment rather than weighted counts alone. If the APS mismeasures even the ratio of inactivity to unemployment, then our estimates will be off by a similar degree. The only alternative data source would be the Census. For example, the Census estimates a slightly lower ratio of inactivity to unemployment for Scotland than the APS for the second quarter of 2022. However, there is no straightforward way of adjusting Census ratios to reflect changes in this ratio over time without reference to other data like the APS.
Administrative data provides limited information about types of inactivity. In APS statistics, inactivity is often broken out by reason into long- or short-term illness or disability, retirement, studying, taking care of family, or being permanently discouraged from the labour market. This breakdown is important for understanding, for instance, whether a rise in inactivity is due to poorer health or to more people retiring early, which have very different policy implications. Current administrative data doesn’t offer a straightforward way of estimating inactivity by reason for the whole population***, so we still don’t have a better alternative to the APS or similar surveys for this information. While administrative data improves on survey data in some respects, it is still important to bear these limitations in mind when interpreting the data.
Final reflections
Data on the labour market is used in decision-making across policy areas, including the design and funding of employability services. Having accurate data on labour markets at a local authority level is crucial to good service design, which in turn furthers policy goals around health inequalities, child poverty, and economic growth.
This report has set out an updated methodology for deriving reasonable national and local labour market statistics from available administrative data.
While our approach is not without limitations, our findings highlight important weaknesses in existing labour market statistics. The evidence suggests that the Labour Force Survey (LFS) and Annual Population Survey (APS) are not sufficiently robust for understanding trends at the local authority level. In this context, administrative data approaches such as the one explored in this report are a valuable and credible starting point for developing more accurate pictures of local labour markets.
The findings point to clear priorities for future data development. The most significant improvement would likely come from more comprehensive and reliable statistics on self-employment. More extensive and timely publication of data from HMRC would substantially improve the evidence base available to policymakers and local stakeholders. Additionally, emerging administrative datasets such as RAPID are promising but require more exploration (and are not accessible for non-experts).
These issues also have important implications for policy and resource allocation. Despite declines in data quality, the Scottish Government currently uses LFS and APS statistics to inform decisions such as the allocation of employability funding among local authorities. As government efforts to explore alternative data sources continue [7], we hope to see a shift away from reliance on APS statistics for funding decisions. We would also recommend better communication of data reliability and interpretation to local authority users.
* In the first instance, HMRC publishes a monthly “flash estimate” of payrolled employment, which is then usually revised the following month (sometimes significantly). This is important to keep in mind when looking at PAYE RTI statistics, although due to the slight lag in other data we use, our estimates based on the administrative data do not use the flash estimates.
** For instance, the state pension age is scheduled to increase from 66 to 67 between 2026 and 2028. Within the period covered by these data, women’s state pension age rose to 65 (from 2016-2018) and the general state pension age then increased to 66 (from 2019-2020). These changes are likely to result in higher employment among those just under the updated pension age.
*** There are some options in administrative data on reasons for inactivity for specific parts of the population. For instance, some inferences on inactivity due to poor health may be drawn from DWP data on people not working and claiming, for instance, the health element of Universal Credit [10]. However, benefit data covers only a specific part of the population, and the conditionality regimes used by DWP do not map neatly onto the usual labour market categorisations [11]. These features of the data make it more difficult to draw conclusions about reasons for inactivity for the population.
Sources
[1] Scottish Health Equity Research Unit, ‘2025 Inequality Landscape’, Scottish Health Equity Research Unit, Glasgow, Sep. 2025. [Online]. Available: https://scothealthequity.org/2025-inequality-landscape/
[2] Scottish Health Equity Research Unit, ‘Addressing Survey Response Challenges and Leveraging Data Integration in Scotland’, Scottish Health Equity Research Unit, Glasgow, May 2025. [Online]. Available: https://scothealthequity.org/addressing-survey-response-challenges-and-leveraging-data-integration-in-scotland/
[3] Office for National Statistics, ‘Labour Force Survey performance and quality monitoring report: October to December 2025’, ONS, Feb. 2026. [Online]. Available: https://www.ons.gov.uk/employmentandlabourmarket/peopleinwork/employmentandemployeetypes/methodologies/labourforcesurveyperformanceandqualitymonitoringreportoctobertodecember2025
[4] Office for Statistics Regulation, ‘OSR’s statement on the Labour Force Survey-derived estimates and Annual Population Survey-derived estimates’. [Online]. Available: https://osr.statisticsauthority.gov.uk/news/osrs-statement-on-the-labour-force-survey-derived-estimates-and-annual-population-survey-derived-estimates/
[5] Scottish Government, ‘The Scottish Government’s Quality Assessment of the Office for National Statistics Labour Force Survey and Annual Population Survey data for Scotland’, Scottish Government, Edinburgh, Apr. 2025. Accessed: Jun. 02, 2026. [Online]. Available: https://www.gov.scot/publications/quality-assessment-of-labour-market-data-sources-phase-1/pages/annex-3-scotlands-labour-market—people-places-and-regions/
[6] OCEA Labour Market Statistics Team, ‘Changes to Labour Market Statistics in Scotland: Events and Resources’. [Online]. Available: https://www.gov.scot/publications/labour-market-statistics-events-and-resources/
[7] Scottish Government, ‘Changes to Labour Market Statistics in Scotland: What You Need to Know’, Scottish Government, Edinburgh, Oct. 2025. [Online]. Available: https://www.gov.scot/publications/changes-to-labour-market-statistics-in-scotland-what-you-need-to-know/
[8] A. Catalano, ‘A new model for economic inactivity in Scotland: Replicating alternative labour market projections’, Scottish Health Equity Research Unit, Glasgow, Feb. 2025. [Online]. Available: https://scothealthequity.org/a-new-model-for-economic-inactivity/
[9] I. Delestre, B. Jacobs-Strom, H. Miller, and K. Smith, ‘New trends in self-employment and top incomes’, Institute for Fiscal Studies, London, Report, Oct. 2025. Accessed: Apr. 20, 2026. [Online]. Available: https://ifs.org.uk/publications/new-trends-self-employment-and-top-incomes
[10] Department for Work and Pensions, ‘Get Britain Working: Labour Market Insights January 2026 – background information and methodology’, Department for Work and Pensions, Westminster, Jan. 2026. Accessed: Jun. 17, 2026. [Online]. Available: https://www.gov.uk/government/statistics/get-britain-working-labour-market-insights-january-2026/get-britain-working-labour-market-insights-january-2026-background-information-and-methodology
[11] S. Thompson, ‘What can benefit data tell us about the labour market?’, Fraser of Allander Institute. Accessed: Jun. 17, 2026. [Online]. Available: https://fraserofallander.org/what-can-benefit-data-tell-us-about-the-labour-market/
Acknowledgements
We are grateful for the input of colleagues in SHERU and the Fraser of Allander Institute, as well as comments from the Scottish Government Office of the Chief Economic Adviser and Public Health Scotland. Many thanks to Isaac Delestre from IFS for sharing information on adjusting self-employment data from the Survey of Personal Incomes.