Comparing poverty rates in Scotland and the rest of the UK
View this article as a PDF
Summary
- Comparing poverty rates in Scotland and the rest of the UK (rUK) can help contextualise Scotland’s performance in tackling poverty and indicate whether Scotland-specific factors are acting to increase or decrease the risk of living in poverty.
- Poverty rates have been lower in Scotland than the rest of the UK since the early 2000s when measured after housing costs. However, the difference has not been statistically significant since 2018-21, meaning we cannot be confident it reflects a real pattern as opposed to variability in the underlying survey data.
- The loss of statistical significance reflects a gradual convergence in poverty rates between Scotland and rUK since the early 2010s, as well as a reduction in the size of the survey sample. There are signs in the latest period (2021-24) that this convergence may be starting to reverse.
- The convergence in poverty rates is broad-based, though increases in poverty risk in Scotland among single adults without children, households receiving Universal Credit where at least one adult is in work but not all are working full time, and social renters account for the largest shares of the convergence between 2011-14 and 2021-24.
- The underlying factors appear to have affected income rather than housing costs, since a similar increase in poverty is evident whether poverty is measured before or after housing costs are subtracted from income. This is in contrast to divergence in poverty rates that occurred in the 2000s, which was driven by differences in housing costs.
- We will continue to monitor these patterns as data improvements are taken forward and more recent data is made available. In upcoming work, we are planning to delve further into the differences in poverty rates between Scotland and rUK among two key groups of interest, namely young adult men and families with children.
Introduction
Poverty rates are affected by a wide range of factors, including economic and demographic shifts as well as government policy. Comparing poverty rates in Scotland with those in the rest of the UK (rUK) can therefore help to contextualise Scotland’s performance in tackling poverty, indicating whether progress has been aided or inhibited by factors that are shared across the UK. Conversely, it can point to the existence of Scotland-specific factors that are acting to either increase or decrease the risk of living in poverty.
Such comparisons do however rely on the data that is available. Official poverty rates are estimated by surveying a sample of households, which is then scaled up to represent the wider population. Although the sample is carefully designed, estimates will inevitably vary depending on exactly which households happen to be surveyed. Statistical significance is a technical way of taking this variability into account. It does not cover all possible sources of error; but if the difference in poverty rates between Scotland and rUK is statistically significant in a given time period, we can at least be confident that the pattern is systematically present in the data.
Poverty after housing costs
Figure 1 compares poverty rates in Scotland and rUK over the last three decades, with poverty measured on a relative basis after housing costs (AHC). Poverty rates began to diverge in the early 2000s, when a gradual reduction was observed in Scotland but not in rUK. In line with previous analysis conducted by the Joseph Rowntree Foundation, we find that this resulted in a statistically significant difference from 2003-06.(1) However, while the estimated poverty rate has remained lower in Scotland than in rUK, the difference has not been statistically significant since 2018-21.
Figure 1: Percentage of people in relative poverty after housing costs, three-year average
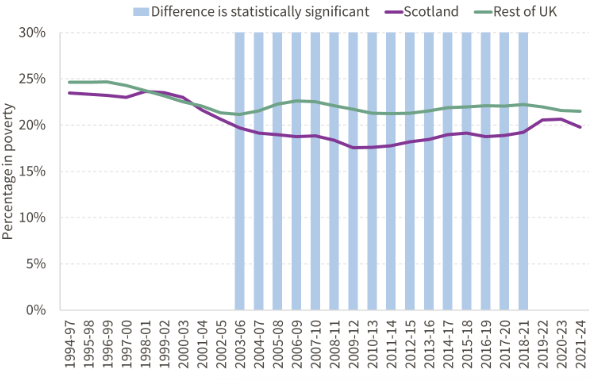
Based on the methodology outlined by DWP, 2025, Measuring Uncertainty in HBAI Estimates. Relative poverty defined as having net equivalised household income below 60% of the UK median. Significance measured at 5% level. Data for 2020-21 has been excluded owing to data quality issues. Source: FAI analysis of DWP, Households Below Average Income
There are two likely reasons that the difference in poverty rates is no longer statistically significant. The first, which is evident in Figure 1, is simply that this difference has narrowed, making it harder to distinguish from statistical variability. The convergence began in the early 2010s, when Scotland began to experience a faster increase in poverty than rUK. It continued up until 2021-24, when poverty fell in Scotland but not in rUK, reflecting the completed roll-out of the Scottish Child Payment in November 2022.
In theory, our use of three-year averages could be diluting the impact of the Scottish Child Payment and other factors that are not fully spread across the time period. Nevertheless, examining single years does not change the overall picture, with the difference in poverty rates between Scotland and rUK failing to achieve statistical significance since 2017-18. Some previous years also fail the significance test, reflecting the increase in variability that comes with using a single year of data (Figure 2).
Figure 2: Percentage of people in relative poverty after housing costs, single year
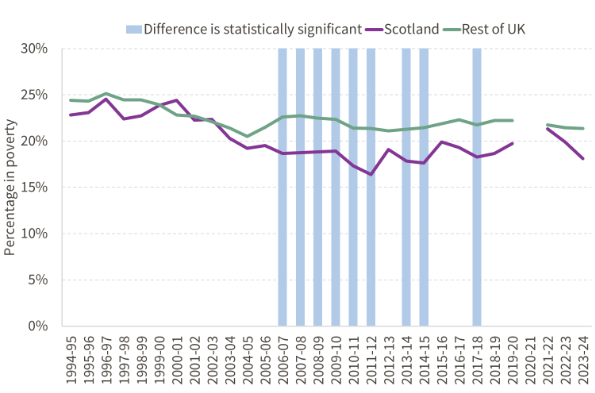
Based on the methodology outlined by DWP, 2025, Measuring Uncertainty in HBAI Estimates. Relative poverty defined as having net equivalised household income below 60% of the UK median. Significance measured at 5% level. Data for 2020-21 has been excluded owing to data quality issues. Source: DWP, Households Below Average Income
This relates to the second explanation for the loss of statistical significance – namely that the size of the survey sample has reduced in recent years, increasing statistical variability.1 Intuitively, responding households are like the pixels that make up a virtual image: as the number of pixels decreases, the picture becomes increasingly indistinct. As shown in Figure 3, the Scottish sample has gradually reduced from nearly 5,000 households in 2002-03, when a 100% boost was introduced, to less than 2,000 in the latest year.
Figure 3: Number of households in Households Below Average Income (HBAI) sample, Scotland
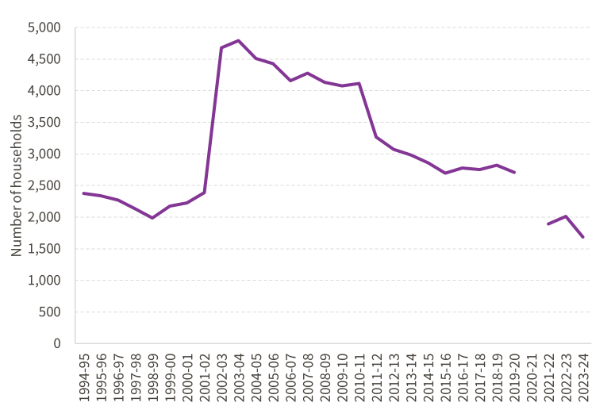
Data for 2020-21 has been excluded owing to data quality issues. Source: FAI analysis of DWP, Households Below Average Income
Although the reduction in sample size has been long running – with a particularly notable reduction in 2010-11, when cost savings were implemented at the UK level – the pandemic has clearly exacerbated this trend in recent years. Note however that the omission of 2020-21 from our analysis – which reflects the data quality issues that arose during the pandemic – does not appear to be a deciding factor when it comes to statistical significance. For example, the difference in poverty rates between Scotland and rUK is significant in the 2018-2021 period, which is affected by this omission, and insignificant in 2021-2024, which is not.
Poverty before housing costs
Figure 4 repeats the analysis for relative poverty before housing costs (BHC). On this measure, the difference between Scotland and the rest of the UK has not been statistically significant since the early 2000s. At that point, the poverty rate was higher in Scotland than in rUK, and the reduction that began thereafter was not as steep on the BHC measure as it was on the AHC measure. This implies that the fall in AHC poverty observed in Scotland over the 2000s – and the resulting difference with rUK – was driven by housing costs rather than income. More specifically, analysis by the Joseph Rowntree Foundation found that that the divergence primarily reflected social rents being lower in Scotland than in England. (1)
On the other hand, beginning in the 2010s, we see a similar increase in Scotland on the BHC measure as we do on the AHC measure, implying that the increase reflected changes in the distribution of income rather than housing costs. Because the initial difference with rUK was much narrower on this measure – and because the poverty rate in rUK has likewise been relatively stable – the estimated poverty rate has been higher in Scotland than rUK since 2019-2021. However, this difference has not been statistically significant, and has narrowed in the latest period.
Figure 4: Percentage of people in relative poverty before housing costs, three-year average
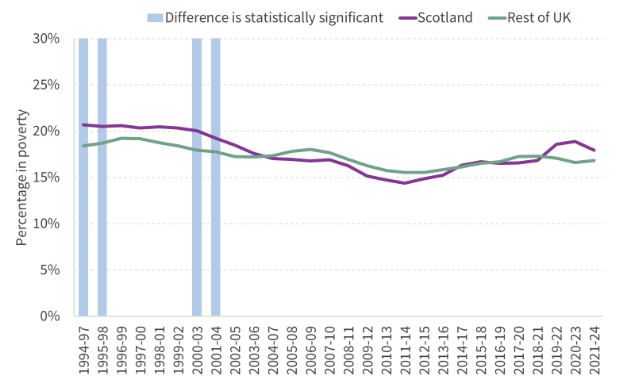
Based on the methodology outlined by DWP, 2025, Measuring Uncertainty in HBAI Estimates. Relative poverty defined as having net equivalised household income below 60% of the UK median. Significance measured at 5% level. Data for 2020-21 has been excluded owing to data quality issues. Source: DWP, Households Below Average Income
Discussion
One question that emerges from this analysis is why poverty rose faster in Scotland than rUK over the 2010s. As an initial step towards answering this question, we can employ the same method as JRF to decompose changes in poverty across three sets of characteristics: family type, tenure type, and the economic status of the family with respect to employment and receipt of Universal Credit or legacy benefits. Note that we are primarily interested in how changes in poverty varied between Scotland and rUK across these characteristics, rather than only the changes within Scotland.
We find that the convergence in poverty rates between 2011-14 and 2021-23 was broad-based. Certain groups play a particularly large role in explaining the convergence, including single adults without children, social renters, and households on Universal Credit with at least one adult in work but not adults working full-time.2 However, across all three sets of characteristics, most groups experienced increases in poverty risk between the two time periods, and most of these increases were larger in Scotland than they were in rUK. Further research is therefore needed to identify the factors that gave rise to the convergence, which, at least on these dimensions, appear to have affected households across the Scottish population.
What is clear is that, at least on these dimensions, changes in the composition of the Scottish population relative to rUK did not make a material difference; the convergence was driven entirely by changes in the incidence of poverty within each group. While it possible that changes in the composition of other characteristics played a more substantial role, this finding points to the influence of economic factors rather than demographic ones per se. Furthermore, the overall pattern is similar whether we examine poverty BHC or AHC. This indicates that, in contrast to the divergence of the 2000s, the convergence of the 2010s was driven by factors that affected income rather than housing costs, which continue to play a protective role in Scotland as compared to rUK.
Another issue raised by this analysis is the quality of the underlying data. The fact that the difference in AHC poverty rates between Scotland and rUK is no longer statistically significant does not imply that the real pattern is the opposite of what we observe – only that the data does not allow us to be confident either way. Although this kind of uncertainty is inherent to survey data, the fall in the size of the sample and the resulting loss of precision is a concern.
Time will tell whether the reduction in poverty that was observed in the latest period marks the beginning of another divergence between Scotland and rUK. Meanwhile, improvements to the survey data are underway, which could potentially have differential impacts across regions.(2) In the coming months, we also plan to investigate differences in poverty between Scotland and rUK among two key groups of interest from a health equity perspective, namely young adult men and families with children, delving further into the factors that underlie these differences.
References
1 Congreve E. Poverty in Scotland 2019 | Joseph Rowntree Foundation [Internet]. 2019 [cited 2025 Dec 6]. Available from: https://www.jrf.org.uk/poverty-in-scotland-2019
2 Department for Work and Pensions. GOV.UK. [cited 2025 Dec 6]. Family Resources Survey: release strategy. Available from: https://www.gov.uk/government/publications/family- resources-survey-release-strategy/family-resources-survey-release-strategy