New child poverty data and updates on methodological changes
Introduction
Families with young children are one of the population groups that SHERU are monitoring closely due to the evidenced links between child poverty and health inequalities. The Health Foundation’s Independent Review of Health Inequalities in Scotland (1) listed rising inequalities in in relation to infant mortality, low birth weight, and risk of obesity amongst others as areas of particular concern and this finding has been carried forward into SHERU’s workplan.
Background
On the 27th March, the Department for Work and Pensions (DWP) published updated statistics on poverty for the UK (2) and the Scottish Government published its breakdown of the Scottish statistics (3). The new statistics cover the period 2023/24.
Scotland is unique in the UK in that it has a set of statutory targets for reducing child poverty. Progress towards these targets is therefore key in evidencing progress towards reducing health inequalities for that group.
The key headline from the new statistics was that Scotland had missed its interim targets on child poverty. However, there has clearly been some substantial progress towards reducing poverty which we believe is due to the Scottish Child Payment.
In SHERU’s report 2024 Inequality Landscape (4) published in September 2024, we had a spotlight on the Scottish Child Payment (SCP). The SCP is a weekly payment to families with children who are eligible for UK means tested benefits (mainly Universal Credit).
The rollout of SCP began in 2021 at £10 for under-sixes, before expanding to all children under-16 and increasing in payment size to £25 a week in November 2022. In the intervening period, bridging payments were also started children over the age of 6. Our 2024 Inequality Landscape report noted concern that the payment was not impacting on the official poverty statistics, making it difficult to assess whether the payment was achieving its stated outcome of reducing child poverty. Our main concern was that we weren’t seeing a divergence from the rUK child poverty trend, which we would have expected (given other parts of the UK have not rolled out similar benefits). We noted that we needed to understand why, and whether, issues with data collection were part of the problem i.e. whether the methodology was picking up fewer children on SCP than should have been the case.
Many groups, but not all, are seeing poverty falling.
Whilst overall relative child poverty levels are falling in Scotland there are some groups of children for whom rates have not fallen and rates are even rising for some. The Scottish Government has six ‘priority groups’ who face the highest risk of poverty. Data for 5 out of 6 of these groups was made available last week and show a mixed bag when comparing 2021-24 trend data to 2020-23 trend data.
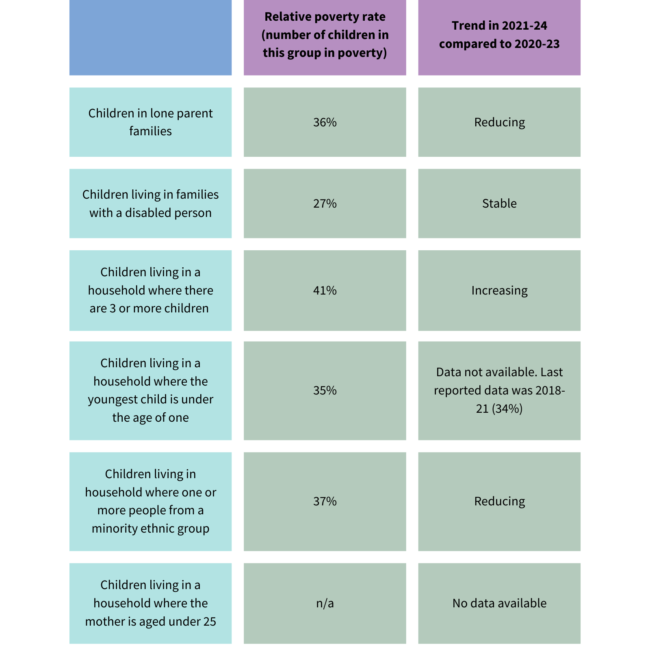
Table 1 – Poverty rates for Scottish Government priority families
One other statistic of note was the trend for rural poverty. Scotland can be split into urban and rural areas, and whilst, in urban areas, relative child poverty reduced from 28% to 24%, the trend in rural areas increased from 15% to 21% (the rise for all people, not just children, was 15% to 17%). Whilst it remains the case that rural poverty remains lower than poverty in urban areas, it is surprising to see the trend for rural areas being so different.
This can also be seen when looking at a local area data (9) released by DWP on the same day which used data on incomes to provide local authority estimates on child in low income families (the definition of “low income” is the equivalent to the definition of poverty used in Scotland). Chart 1 averages across the Scottish Government’s fourfold urban rural classification (10), and shows an urban gradient: the more urban a local authority, the bigger the reduction in relative low income between 2023 and 2024.
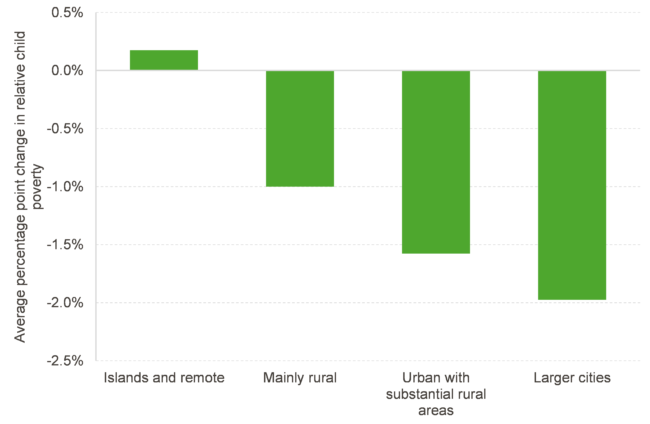
Chart 1: Relative rate of children in low-income families (child poverty) between financial year end 2023 and 2024, fourfold urban rural classification (Source: Children in Low Income Families, DWP)
The fact that child poverty is not uniformly falling across all groups and all parts of Scotland indicates that there are potentially other factors that are countering the Scottish Child Payment and pushing child poverty upwards. SHERU is planning on further work on this in the Summer once we have the full dataset from these statistics (typically available from UK Data Service a few months after the statistics are first released) to better understand the different factors impacting on child poverty in Scotland, and the wider UK. This knowledge should help policy makers make more effective policy decisions in their efforts to reduce child poverty further.
Enhancing the evidence base further
Our 2024 Inequality Landscape report also referenced improvement work that DWP had been undertaking in recent years to link survey records to administrative records to improve accuracy of income and poverty statistics. Last week, the DWP confirmed that they will integrate DWP benefit data into the new statistics for the 2024/25 statistics, due in March 2026. At the moment, we are unsure whether Social Security Scotland’s administrative data records will also be incorporated to ensure consistency across the UK. We are also unsure whether linking of administrative data on earnings will take place at the same time. Ideally, the linking of earnings would happen at the same time as the linking of DWP benefits, and the devolved benefits administered by Social Security Scotland would also be included.
The most likely consequence of linking administrative data on benefits will be a reduction in levels of poverty. This is because lower income households are likely to have more of their earnings from benefits and the survey currently under-reports on benefit claimants – either because people don’t report that they are receiving benefits or because of issues with the sample chosen. Linking to benefit records, and an additional step of grossing up benefit totals to match administrative totals, should address this issue.
However, administrative linking or earnings records could push things to the other way. The IFS reported last week that they believe that DWP’s survey is underreporting earnings (11). If this is true, and administrative linkage picks up more earnings, this is likely to increase the relative poverty statistic because higher income households are more likely to have more of their income from earnings.
Significant changes in how poverty is measured are on the horizon in the coming years. For those focused on child welfare, the key concern remains whether poverty is rising or falling. These refinements will enhance our ability to assess the impact of social security policies on poverty rates—a positive step forward. However, shifts in measurement methods could lead to substantial changes in the reported number of children in poverty, creating potential confusion and a dilemma for the Scottish Government. If child poverty rates fall purely due to a methodological update, can the Scottish Government claim that it has made progress in reducing child poverty? Most would disagree, but with elections approaching, it might be difficult to resist.
Conclusion
The latest data on child poverty in Scotland presents a mixed picture. While overall child poverty rates are declining, Scotland has missed its interim targets, and progress remains uneven across different groups and regions. The Scottish Child Payment has likely played a significant role in reducing poverty, yet it is not sufficient in isolation to eradicate poverty in Scotland.
Upcoming methodological improvements and the integration of administrative data into poverty statistics could lead to shifts in reported figures, making it crucial to differentiate between real progress and statistical adjustments. It is also important that Scottish data is part of these improvement efforts.
Looking ahead, further action from the Scottish Government in the form of policy measures, particularly in relation to social security, will be needed to reach the 2030/31 child poverty targets. SHERU will continue to analyse emerging data and provide insights to support evidence-based policymaking as well as taking forward work at local and community level to ensure we can understand more about the impact of decisions taken and the lived experience of those that are at the highest risk of poverty.
Sources
1. Finch D, Wilson H, Bibby J. Leave no one behind. The state of health and health inequalities in Scotland London: The Health Foundation. 2023.
2. Department for Work and Pensions. Households below average income (HBAI) statistics. 2025.
3. Scottish Government. Poverty and Income Inequality in Scotland 2021-24. 2025.
4. Catalano A, Congreve E, Jack D, Smith K. 2024 Inequality Landscape: Health and Socioeconomic Divides in Scotland. 2024.
5. Randolph H, McFadyen C, Congreve E. Do Scotland’s child poverty statistics capture the impact of the Scottish Child Payment? ; 2025.
6. Scottish Government. Child poverty modelling: update. 2025.
7. Randolph H, McFadyen C, Congreve E. Meeting Scotland’s child poverty targets: Modelling and policy packages. 2025.
8. IPPR Scotland. Achieving the 2030 child poverty target: The distance left to travel. 2025.
9. Department for Work and Pensions. Children in low income families: local area statistics. 2025.
10. Scottish Government. Understanding the Scottish rural economy: research paper 2018 [Available from: https://www.gov.scot/publications/understanding-scottish-rural-economy/pages/13/.
11. Ray-Chaudhuri S, Wernham T. New data suggest dramatic decline in living standards, but it may just be the quality of the data that has declined: Institute for Fiscal Studies; 2025 [Available from: https://ifs.org.uk/articles/new-data-suggest-dramatic-decline-living-standards-it-may-just-be-quality-data-has.